Recently, while working with a client’s suite of legacy apps to find performance issues, I turned to Application Insights Automatic Instrumentation for help. However, even the most handy tools have their quirks. Here’s how to navigate some tricky spots when it appears not to log as expected.
Enabling Application Insights
There are two ways that Application Insights instrumentation can be added to a Web Application in Azure:
- Via Application Insights SDK (via code)
- Via Automatic Instrumentation (in the Portal)
Using the Application Insights SDK is the preferred approach for sure.
Sometimes however, the codebase has no logging infrastructure so there is nothing to hook into! In that scenario, resort instead to the Automatic Instrumentation option.
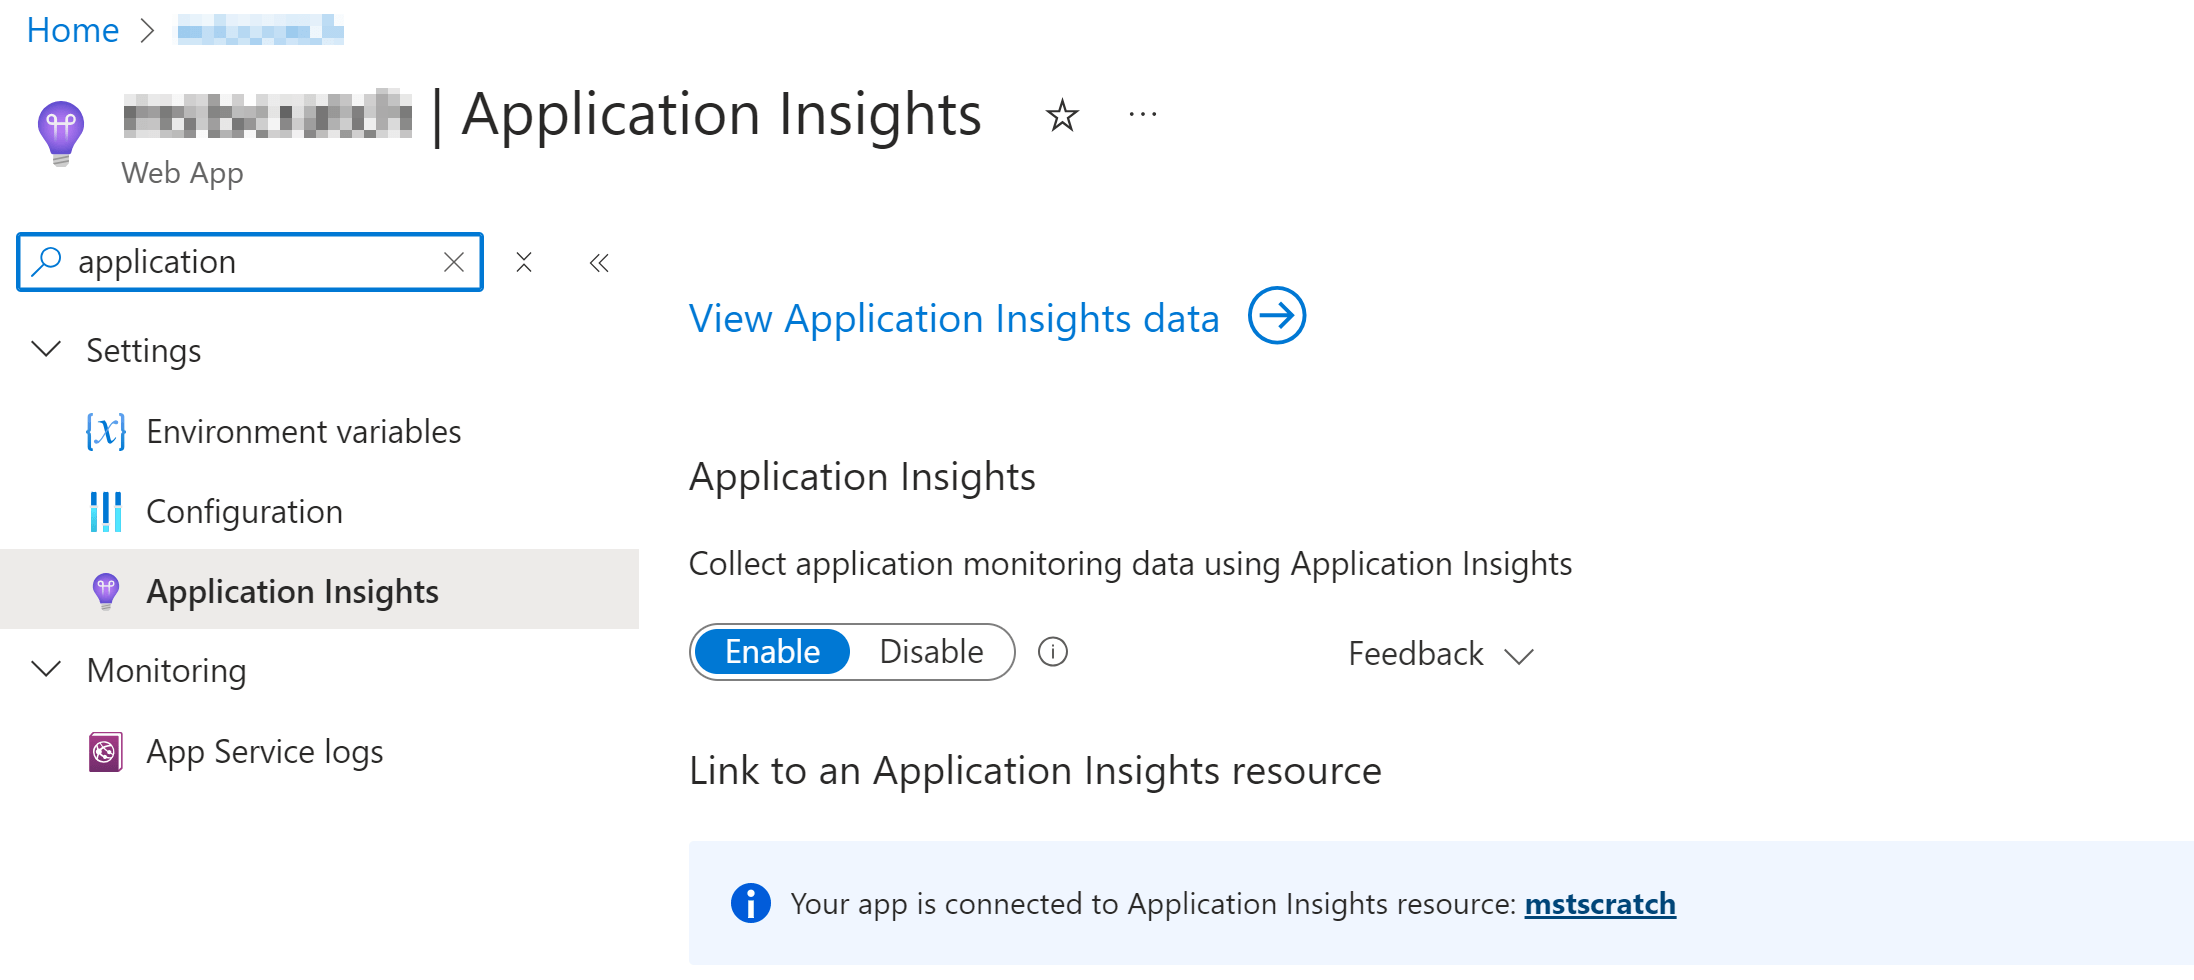
To enable Application Insights Automatic Instrumentation, simply go to your application’s Azure portal page, navigate to the Application Insights section, and turn on the Automatic Instrumentation feature.
Simple - what could go wrong?
It’s Gone Wrong: There’s No Logs!
If you suspect Application Insights isn’t logging correctly, you’ll notice:
- Live Metrics only display “demo” graphs
- Application Map shows no data
- No Request tracing is available.
From the Web App’s Application Insights blade in the Azure Portal, it all looks fine.
So what’s wrong?
What Does the Application Insights Status Page Show?
Until recently, I didn’t know this existed! Somehow it had passed my by, but there is a status page for Application Insights in your Web App when using Auto Instrumentation.
This is available on the scm path for your app, so replace name-of-the-webapp below with your Web App name:
https://name-of-the-webapp.scm.azurewebsites.net/ApplicationInsights
This will give you the first idea of what may be at fault and provide the log output for further information.
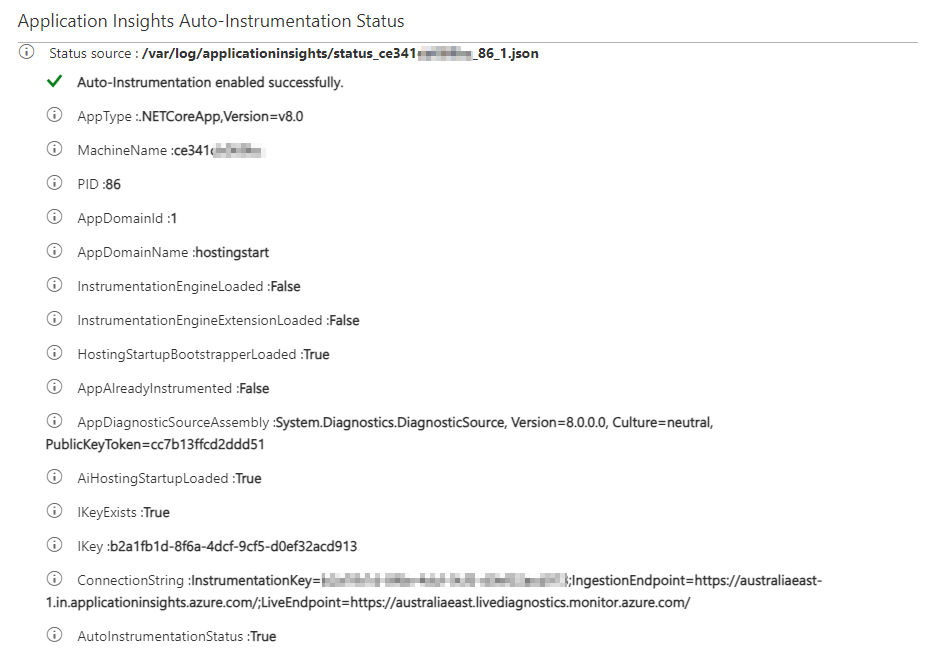
If it looks healthy, it’ll look like the following screenshot:
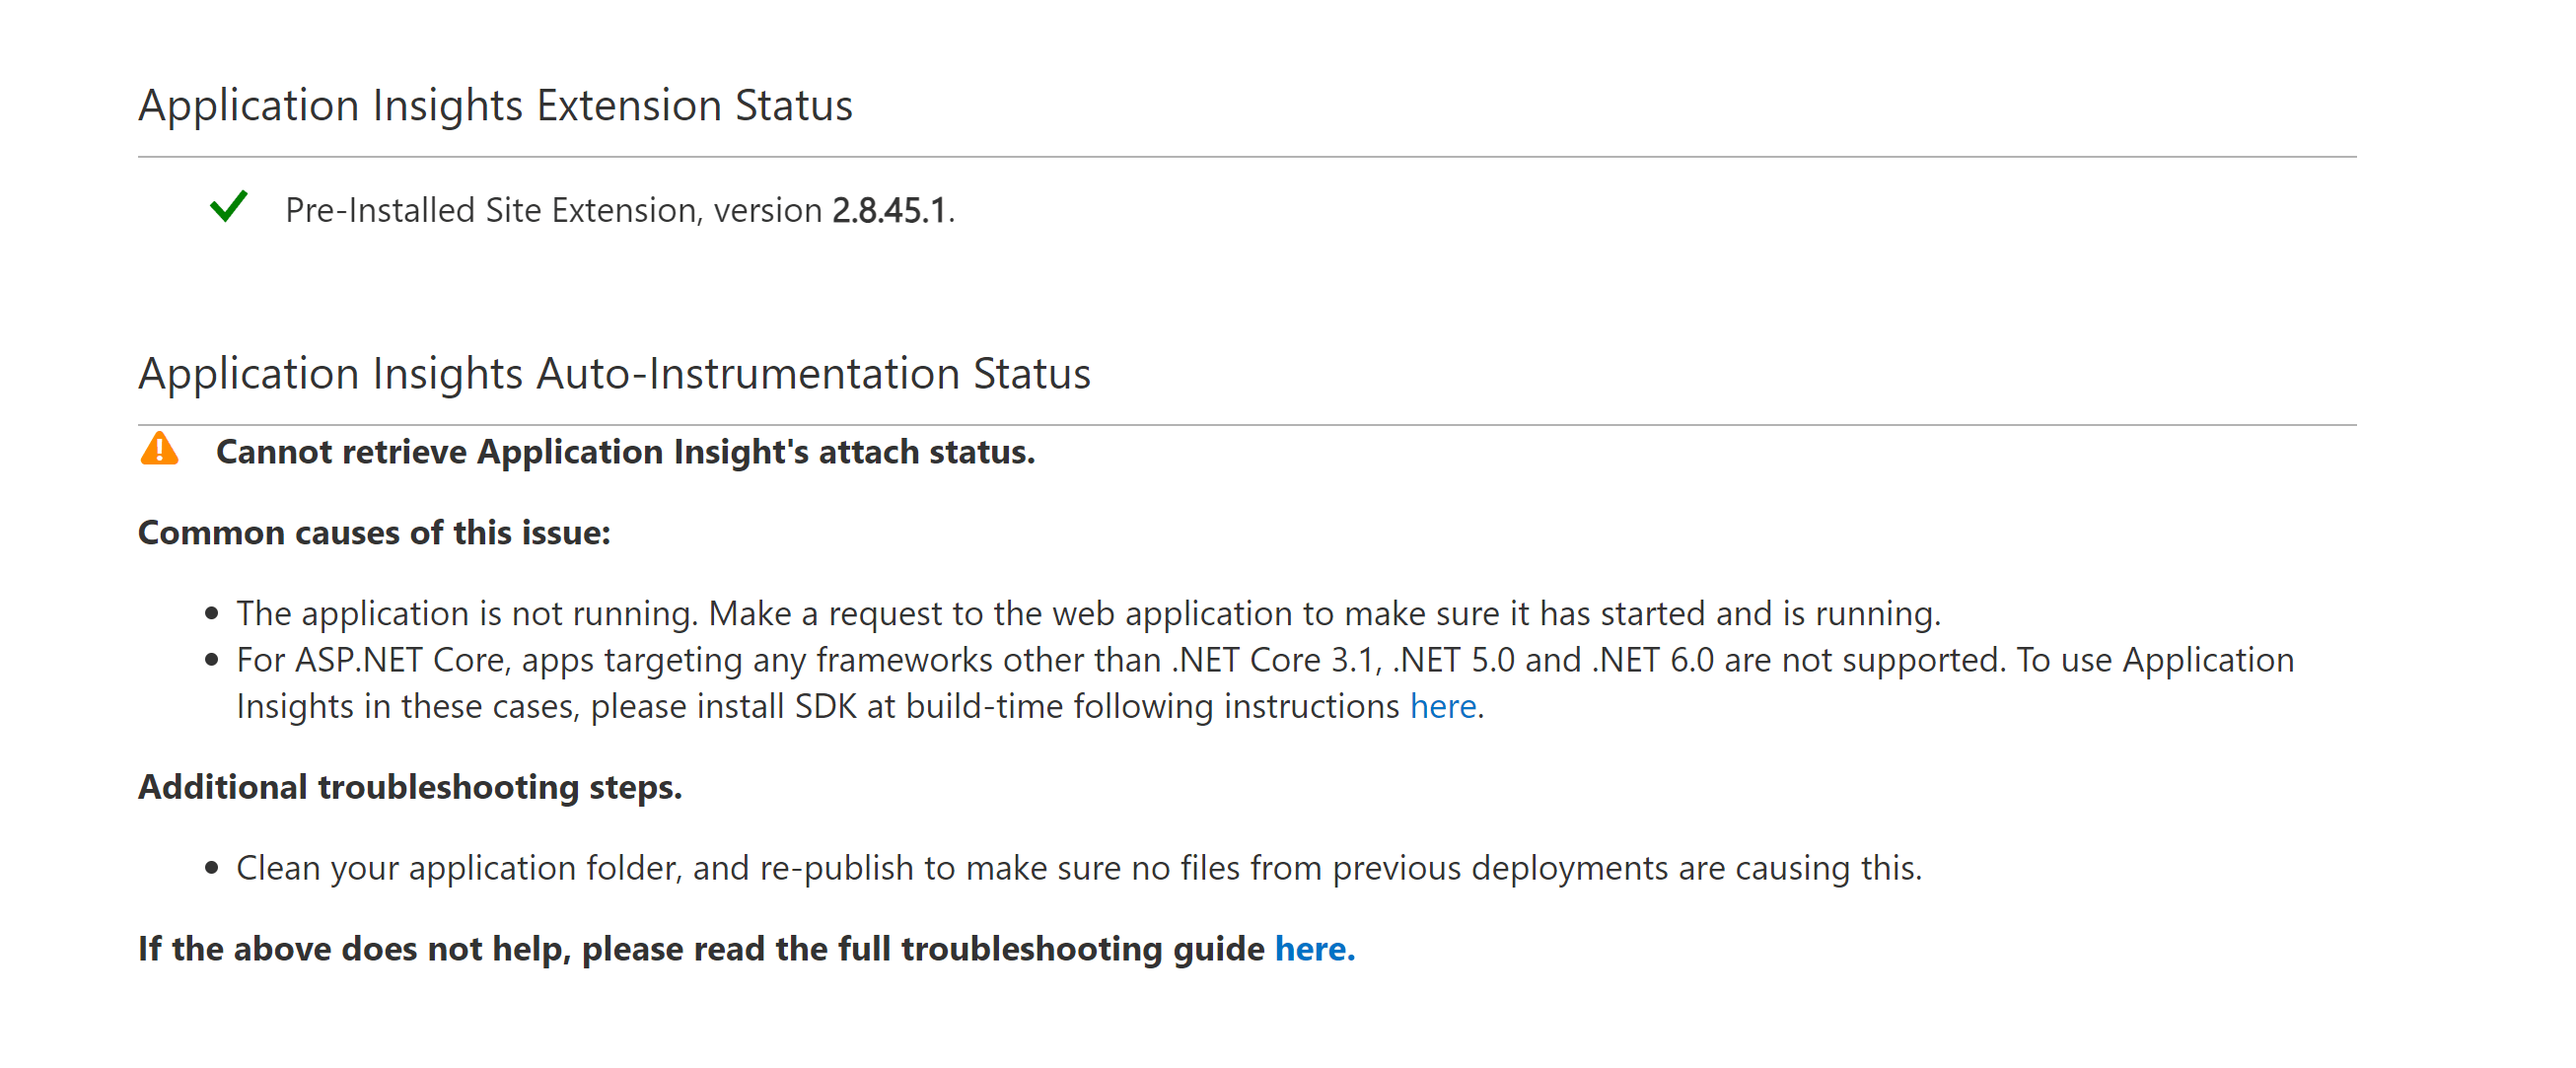
When it’s unhappy, it’ll give a few clues to follow as to why.
There’s a full troubleshooting guide from Microsoft that will help decipher what it’s trying to tell you.
Is My Environment Supported by Application Insights?
Automatic Instrumentation makes use of an agent or HTTP Module extension (depending on the service) which means it can log data without making any changes to the code.
Given this, it’s important to verify though that your app uses a supported environment for the extension:
| Environment/Resource provider | .NET Framework | .NET Core / .NET | Java | Node.js | Python |
|---|---|---|---|---|---|
| Azure App Service on Windows - Publish as Code | ✅ | ✅ | ✅ | ✅ | ❌ |
| Azure App Service on Windows - Publish as Docker | ✅ | ✅ | ✅ | ✅ | ❌ |
| Azure App Service on Linux - Publish as Code | ❌ | ✅ | ✅ | ✅ | ❌ |
| Azure App Service on Linux - Publish as Docker | ❌ | ✅ | ✅ | ✅ | ❌ |
| Azure Functions - basic | ✅ | ✅ | ✅ | ✅ | ✅ |
| Azure Functions - dependencies | ❌ | ❌ | ✅ | ❌ | ✅ |
| Azure Spring Cloud | ❌ | ❌ | ✅ | ❌ | ❌ |
| Azure Kubernetes Service (AKS) | ❌ | ❌ | ✅ | ❌ | ❌ |
| Azure VMs Windows | ✅ | ✅ | ✅ | ❌ | ❌ |
| On-premises VMs Windows | ✅ | ✅ | ✅ | ❌ | ❌ |
| Standalone agent - any environment | ❌ | ❌ | ✅ | ❌ | ❌ |
For one of the apps I had, it was a Python-based docker container, which is firmly on the not-supported list for Automatic Instrumentation.
The only option there is to make code changes to use the SDK, which is now based on OpenTelemetry.
Instrument via SDK or Automatic, But Not Both?
For another application, the AppAlreadyInstrumented value showed as True on the status page, indicating that the Automatic Instrumentation module couldn’t load because the App Insights SDK was already active in the app.
This meant the app was set up to log via the SDK, unbeknown to me.
However, this duel setup - using Automatic Instrumentation and SDK - leads to no data being logged. It gets into a conflicted state, resulting in a complete lack of logging data.
While turning on Automatic Instrumentation might seem like an easy fix, it’s not always the solution. It’s worth taking a closer look to see if there’s a misconfiguration with the SDK-based logging instead.
Key Takeaways
Effectively integrating Application Insights requires a choice between SDK-based and Automatic Instrumentation. The SDK-based approach is preferred, but it’s not always an option to update the codebase.
So, when utilizing Automatic Instrumentation, rely on the Application Insights status page for crucial diagnostics and steer clear of combining instrumentation types to avoid data loss.